

Fix the root cause of No-Call No-Show with help from TeamSense
Table of Contents
- Why attendance volatility is a manufacturing cost problem
- The business case for reducing attendance volatility
- Industry benchmarks and standards for attendance volatility
- How to calculate ROI of absenteeism reduction in manufacturing
- Example ROI model for a manufacturing plant
- What data teams need to measure attendance volatility ROI accurately
- How to strengthen the case with interventions that actually reduce volatility
Most manufacturers already track absenteeism. The harder question is what absenteeism actually costs when it shows up as volatility. It is not just about how many people are out over the course of a year. It is about what happens when call-offs hit without warning, key roles go uncovered, and supervisors have to reshuffle the floor to keep production moving.
That is where the real operational impact starts to show up. Two plants can have similar absence rates on paper but very different outcomes at shift start. One runs normally. The other loses time chasing coverage, stretching trained workers across multiple roles, leaning on overtime, and slowing down critical parts of the line. The difference is not just absenteeism. It is attendance volatility.
If you want to quantify the ROI of absenteeism reduction in manufacturing, you have to look beyond the annual absence percentage. The stronger business case comes from measuring what unpredictable attendance forces the plant to spend, delay, or absorb. That includes overtime, labor reshuffling, productivity loss, supervisor time, and the ripple effects that follow when one missing role disrupts the rest of the operation.
Why attendance volatility is a manufacturing cost problem
Attendance volatility is not just about people missing work. It is the uneven, hard-to-predict pattern of call-outs across shifts, crews, roles, and days that forces supervisors to scramble.
That is why volatility can do more damage than the average absence rate alone. A planned vacation is usually manageable. A cluster of short-notice call-outs on a bottleneck line is a different problem entirely.
Manufacturing is especially sensitive because labor is tied directly to shift coverage, machine utilization, line balance, quality checks, and material flow. When the right person is missing at the wrong time, just one absence can cause line productivity loss in manufacturing, and the plant pays for it through overtime, temp usage, line reshuffling, supervisor time, lower throughput, and sometimes downtime.
The labor backdrop makes the issue more urgent. In NAM’s Q1 2025 survey, 48.41% of manufacturers said attracting and retaining a quality workforce was a top business challenge, and Deloitte with The Manufacturing Institute projected that U.S. manufacturing could need as many as 3.8 million new employees between 2024 and 2033, with nearly 1.9 million roles potentially going unfilled. In that environment, the hidden risk of skill gaps on manufacturing shifts amplifies the impact of every unexpected absence.
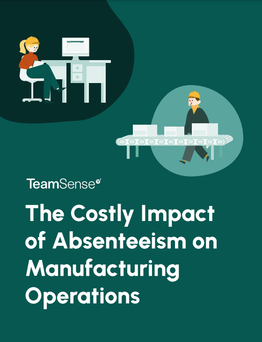
The Costly Impact of Absenteeism on Manufacturing Operations
Learn how chronic, unplanned absenteeism is a costly impediment to manufacturing productivity and efficiency, and how you can reduce absenteeism.
Absenteeism rate vs. attendance volatility
Two plants can post the same annual absence rate and still have very different operating results. One plant may have most absences spread out and planned. The other may get repeated Monday call-outs, pre-shift no-shows, or absences concentrated in a few critical roles, which is why relying on monthly absence reports that hide daily staffing risk can leave real volatility unaddressed.
That is the difference between absenteeism rate and attendance volatility. The rate tells you how much time was missed overall. Volatility tells you how disruptive that missed time was.
On the floor, timing and concentration matter. A missing forklift driver, maintenance tech, lead operator, or quality technician can slow the whole line, even if the total number of absent hours looks ordinary on paper.
That is why annual averages are not enough. To quantify the problem correctly, plants need internal data by shift, day of week, line, department, and role criticality, not just a sitewide absence percentage, and many start by using an absence rate percentage calculator for frontline teams to understand where coverage is breaking down.
The business case for reducing attendance volatility
Reducing attendance volatility is not an HR clean-up project. It is an operations and finance lever. Absenteeism’s impact on manufacturing productivity is substantial, so reducing absenteeism is a primary goal for manufacturing organizations, as it directly impacts productivity, lowers costs, and improves overall operational efficiency.
The direct costs are easy to see. You can usually pull them from payroll, scheduling, and temp invoices. The indirect costs are harder to see, but they are often where the real money sits. Any investment in absenteeism reduction should be evaluated for its return on investment, as reducing absenteeism in the manufacturing sector typically yields a high ROI, ranging from 3:1 to 5:1 within the first year. Unscheduled absenteeism can cost approximately $3,600 per year for each hourly worker. Using an absence tracking ROI calculator can help translate those costs into a defensible business case. Reducing absenteeism also lowers the need for expensive overtime pay and temporary contract workers.
Labor cost is the obvious starting point. Average hourly earnings in manufacturing were $36.39 in February 2026, and manufacturing average hourly earnings were $35.19 with an average workweek of 40.1 hours in June 2025. But wage replacement alone rarely captures the full impact.
Production risk is where the business case gets stronger. In Siemens’ 2024 downtime report, surveyed large plants lost an average of 27 hours per month to unplanned downtime, and the report estimated average annual downtime losses of $253 million for large plants in the sectors surveyed. Resources that outline how to minimize downtime with a systemized playbook and explain the financial impact of unplanned downtime in manufacturing reinforce how instability in labor and instability in output often show up together.
Direct cost buckets to include in the ROI model
Start with the line items finance can validate fast. That usually includes paid hours not worked where applicable, overtime premium paid to cover absences, temp labor premium, and supervisor or scheduler time spent patching holes in the schedule.
You should also include training and cross-training time used to backfill weak spots. If you are paying attendance incentives, referral bonuses, or other reliability-related costs, those belong in the model too.
In some plants, volatility also drives turnover. If repeated forced overtime or unstable scheduling pushes people out, recruiting and replacement cost may belong in the analysis, but only when you can defend that link with your own data. A shift from simple headcount metrics to headcount vs. skill coverage in manufacturing can clarify whether gaps are about bodies or capabilities.
The point is simple. If payroll, scheduling, and HRIS can show the spend, it belongs in the direct-cost section of the business case.
Indirect cost buckets that usually matter more
Indirect cost is where many plants undercount the damage. When attendance volatility hits the floor, the problem is not just who got paid. The bigger question is what the plant could not produce, what it produced poorly, and what it had to recover later.
That includes lost throughput, slower cycle times, disrupted changeovers, missed output targets, scrap, rework, late shipments, and expedite costs. It can also include downtime risk when key operators or maintenance support are not available at the right time, underscoring the operational risk of unpredictable attendance in manufacturing.
Repeated forced overtime creates a second-order cost as well. It raises fatigue, strains morale, and increases the odds that your most reliable people burn out or leave, which makes the next schedule even harder to cover.
Safety exposure belongs in this section, too. Understaffed or unfamiliar crews may still get the shift through, but the operating risk goes up when people are moved into roles without enough preparation.
Industry benchmarks and standards for attendance volatility
Manufacturing attendance benchmarks matter because they help you figure out if your plant's call-off problems are normal or if something's really broken. When workers don't show up as expected, it hits production hard. You're scrambling for coverage, burning overtime, and watching line efficiency tank. Plants with steady attendance run smoother. Plants with unpredictable call-offs? That's where you see supervisors pulling their hair out every morning.
Most plants track their numbers against industry standards to see where they stand. These benchmarks come from real data - no-show rates, last-minute call-offs, how many people actually show up versus the schedule. Say the industry average for no-shows is 8% and you're hitting 15%. That tells you something's off. Maybe it's your attendance policy, maybe it's morale, maybe it's how you handle call-offs. Using a clear guide to calculating employee absenteeism rates ensures those numbers don’t lie.
Here's the thing - these standards help you set realistic expectations and fix what's actually broken. You can spot patterns too. Maybe Monday morning call-offs spike after overtime weekends. Or maybe certain shifts have higher no-show rates. When you know what normal looks like, you can tackle the real problems instead of just reacting to each crisis. Better attendance means fewer headaches, steadier production, and supervisors who aren't constantly firefighting coverage gaps.
Is your call-in process terrible? Reduce no-shows and absenteeism by up to 40%.
How to calculate ROI of absenteeism reduction in manufacturing
The basic formula is straightforward: ROI = (annual financial benefit - annual program cost) / annual program cost, and tools like an absence tracking ROI calculator for absenteeism programs can help structure the inputs consistently.
What makes the model credible is not the formula. It is the discipline behind the inputs. You need a real baseline, a realistic improvement assumption, clear cost buckets, and annualized savings that do not double-count the same impact twice. ROI analysis is essential for justifying corporate programs by demonstrating both direct cost savings and intangible benefits, supporting decision-making, and highlighting the value of the initiative. Establishing clear baseline measurements and regularly monitoring both utilization and outcome metrics allows for program refinements and demonstrates value.
Payback period matters too. Finance leaders often want to know how many months it takes for the savings to cover the program cost, especially when the solution requires software, training, policy redesign, or change management.
Build the model as a baseline state versus a future state. Then run it conservatively first. If the business case still works under conservative assumptions, it will hold up better in front of operations and finance.
Step 1: Establish the baseline volatility and its current cost
Start with the last 6 to 12 months if you can. Pull absence frequency by shift, team, role, line, and day of week, then isolate the short-notice call-outs that create real disruption.
From there, map what happened next. Measure open-shift fill rate, overtime triggered by absence, temp fill rate, temp premium, and how often supervisors had to reshuffle labor to keep the line moving, tying those metrics back to your shift coverage planning for manufacturing operations.
Then connect labor gaps to plant outcomes. Look for understaffing events that line up with throughput loss, downtime minutes, scrap spikes, missed service levels, or delayed changeovers.
Do not use external benchmarks as your baseline. Use them only as context. The ROI model needs to reflect your own HRIS, time and attendance, scheduling, MES, ERP, quality, and maintenance data.
Step 2: Estimate the achievable improvement
This is where weak business cases usually go off the rails. Teams assume the solution will eliminate the problem, then build savings on best-case thinking.
A better approach is to build three cases: conservative, expected, and upside. Separate improvement in overall absenteeism from improvement in volatility, because a plant can reduce disruption even if total absences do not fall dramatically.
Tie each improvement assumption to a specific intervention. If you are adding self-service call-out workflows, cross-training, float coverage, or better shift fill processes, explain exactly which failure point each one is supposed to improve, and consider updated manufacturing absenteeism strategies like text-based call-off systems as part of that design.
If you have pilot data, use it. If you do not, stay conservative and avoid assuming that 100% of absence-related cost disappears.
Step 3: Convert improvement into annual financial benefit
Once you estimate the improvement, translate it into money using distinct savings buckets. Common categories include overtime savings, temp labor savings, recovered production hours, regained margin on output that would otherwise be missed, and lower scrap or rework. Many of the core strategies to reduce workplace absenteeism feed directly into these savings buckets.
Some plants can also justify reduced expedite charges, lower service-failure penalties, or lower turnover-related labor costs. The key word is justify. If finance cannot trace the logic, it should not be in the model, just as guidance on how to address excessive absenteeism while supporting employees stresses clarity and fairness in your approach.
Be careful with overlap. If you already counted recovered production hours based on contribution margin, do not count the same event again as downtime recovery unless those are truly separate costs.
A clean model is better than a big model. Finance will trust a smaller number with clear logic faster than a larger number built on stacked assumptions.
Step 4: Subtract the cost of the solution
Gross savings do not matter if you ignore the implementation cost. Include the full cost of the response, not just the subscription or software fee.
That may include implementation and integration work, training time, change-management cost, manager admin time, incentive spend, policy redesign, and any temporary productivity dip during rollout. If the solution changes workflows on the floor, account for that too.
This step is what makes the model believable. Plants lose credibility when they present savings as if improvement happens for free.
Step 5: Present ROI, payback period, and sensitivity analysis
Once benefits and costs are in place, present the result in a format finance can review quickly. Show the ROI percentage, the payback period in months, and the conservative, expected, and upside cases side by side.
Then call out the assumptions that move the outcome most. In many plants, that will be overtime replacement rate, temp premium, contribution margin on recovered output, or the share of labor gaps that hit bottleneck roles.
Document every assumption in a simple table or appendix. If someone asks where the number came from, the answer should be easy to find.
Example ROI model for a manufacturing plant
Here is a simple illustrative model. It is not a benchmark, and it is not meant to represent every plant. It is just a way to show the logic.
A recent case study from TechCraft Manufacturing demonstrates the potential for measurable outcomes and measurable results from Employee Assistance Programs (EAPs). After implementing an EAP that included confidential counseling, manager training, and work-life balance initiatives, TechCraft achieved a 25% reduction in absenteeism within 12 months, a 12% increase in productivity measured by output per labor hour, and a reduction in voluntary turnover from 19% to 11%. The EAP led to an estimated return of $495,500 against an investment of approximately $72,000, resulting in a measurable ROI of nearly 7:1. Additionally, 88% of managers reported feeling better equipped to support team members, and employee engagement scores increased by 17 points. When implemented properly, Employee Assistance Programs deliver measurable business impact beyond employee wellbeing. A well-designed EAP can lead to a significant return on investment for organizations by reducing absenteeism and improving productivity. Broader research on workplace absenteeism causes, costs, and solutions supports the link between targeted support programs and lower absence volatility. Customized EAPs that address both individual needs and organizational factors are more effective in reducing absenteeism and can lead to improved employee engagement and workplace culture.
Assume a plant uses the February 2026 manufacturing average hourly earnings benchmark of $36.39 as a wage proxy for example math. All other figures below are hypothetical assumptions that should be replaced with plant-specific data.
A hypothetical plant identifies that short-notice attendance volatility is driving recurring overtime and occasional temp coverage on one labor-constrained line. The plant estimates that a targeted intervention could reduce the number of disruptive call-out events enough to cut overtime tied to absences, reduce temp premium spend, and recover some production time that is currently lost to line disruption, mirroring the connection many plants see between attendance gaps and unplanned downtime costs in manufacturing.
Using that logic, the plant builds three annual savings buckets. First, it estimates overtime premium savings from fewer last-minute replacements. Second, it estimates temp labor savings from better fill rates and cross-trained coverage. Third, it estimates recovered contribution margin from production hours no longer lost to understaffing at a bottleneck.
If those annual savings add up to more than the annual cost of the solution, the plant has a business case. If the payback period is short and the conservative case still clears the hurdle, the case gets stronger.
Inputs the example must include
At minimum, the example needs headcount, shifts per day, baseline absenteeism or short-notice absence level, overtime replacement rate, temp labor premium, the value of one recovered production hour or unit, program cost, and the time horizon. It is essential to ensure that the ROI model is aligned with the organization's overall strategy, so that measurement frameworks and KPIs support broader business objectives.
Use the wage benchmark carefully. Manufacturing average hourly earnings were $36.39 in February 2026, which can help frame example wage math, but your actual labor cost should come from your payroll data, including shift premiums and burden where appropriate.
If you need a rough weekly context for examples, BLS reported manufacturing average hourly earnings of $35.19 and average weekly hours of 40.1 in June 2025. But once the model moves beyond rough illustration, plant-specific cost data should take over.
The value of recovered production is where the model becomes real. That number should come from internal contribution margin, bottleneck capacity economics, or customer service cost, not from a generic benchmark.
Mistakes that make ROI calculations unreliable
The first mistake is treating every absent hour as fully lost output. In many plants, some of the gap gets covered through overtime, cross-training, schedule reshuffling, or delayed production.
The second mistake is double counting. If you count downtime cost and throughput loss from the same event, or count both saved overtime and fully recovered output without adjusting for overlap, the model will overstate value.
Another common problem is relying on broad external benchmarks instead of plant data. Benchmarks can help frame the issue, but they cannot replace actual payroll, production, quality, or maintenance records. It's important to follow industry best practices for measurement, using standardized metrics and tailored approaches aligned with organizational goals.
The last big mistake is presenting best-case assumptions as the expected case. That is the fastest way to lose finance support. Regular communication about EAP services can help normalize their usage among employees, leading to better outcomes.
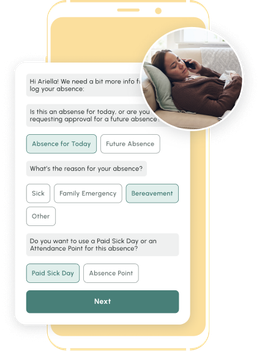
No one wants to talk to their boss or a 1-800 stranger to call off. Text changes everything - Reducing No Call No Shows.
What data teams need to measure attendance volatility ROI accurately
A defensible model requires more than HR data. Attendance volatility touches labor planning, line performance, quality, maintenance, and finance, so the data has to come from multiple systems. Gathering valuable insights from these data sources and employee feedback enables organizations to refine their absenteeism reduction strategies and demonstrate the ROI of their initiatives.
Start with HR and time-and-attendance records to understand absence patterns. Add scheduling and overtime data to show how the plant responded. Then bring in production, throughput, quality, scrap, and maintenance data to show what happened downstream; modern attendance tracking software for hourly employees can make pulling and connecting this data far easier.
Granularity matters. Sitewide monthly averages usually hide the real damage. The useful level is line, shift, crew, role, and day.
Finance should validate the savings logic before the model is socialized. That helps prevent arguments later about whether recovered hours are truly recoverable, or whether a cost was already absorbed somewhere else in the P&L.
Additionally, creating a culture where seeking support is normalized enhances EAP utilization, which can further contribute to absenteeism reduction and improved ROI.
Metrics to track before and after the intervention
Track the basics first: absence rate, short-notice absence rate, attendance volatility by shift and role, overtime hours tied to absence, and temp labor hours.
Then track operating outcomes: line staffing attainment, throughput per labor hour, scrap and rework rate, downtime minutes linked to labor gaps, and turnover in the teams carrying the heaviest overtime burden. These are the same levers most frameworks for tackling excessive absenteeism with practical solutions aim to improve.
The goal is not just to prove the program worked once. It is to show whether reduced volatility actually changed the cost structure and made the operation easier to run. Tracking improvements in accessibility and engagement, such as through simple changes that enhance inclusivity, can also demonstrate progress and organizational values.
A before-and-after view is important, but trend data is even better. If the plant improves for one month and slips back the next quarter, the ROI story is incomplete. Training for managers on how to support employees can further enhance the effectiveness of Employee Assistance Programs, leading to more sustainable absenteeism reduction.
How to strengthen the case with interventions that actually reduce volatility
The strongest ROI model is tied to interventions that clearly address the source of disruption. If the problem is late call-outs with no backfill process, fix that. If the problem is weak coverage in a few critical roles, fix that. If the problem is rigid scheduling that pushes people into avoidable absences, fix that.
Possible levers include more flexible scheduling, shift bidding or self-scheduling where it fits the operation, attendance policy redesign, cross-training, float pools, manager response workflows for call-outs, and workforce management software that helps fill gaps faster. NIST’s Manufacturing Extension Partnership also emphasizes workforce development, training, retention, and engagement as part of improving manufacturing performance.
Collaboration and partnerships are key drivers of event success and long-term outcomes in manufacturing environments. Fostering active engagement among employees through collaborative initiatives and strategic partnerships can lead to measurable improvements in absenteeism reduction and ROI. Active engagement is a powerful predictor of event success and subsequent ROI. The most successful events don't just attract attendees they activate them.
Engaging the audience and encouraging participation through interactive strategies, such as team-based problem solving or digital feedback tools, can further boost involvement and outcomes. Encouraging user generated content, like sharing best practices or success stories, can extend engagement and amplify the impact of interventions.
Support programs can matter too, but only when they match the real problem. Transportation support, childcare help, wellness resources, and supervisor communication can reduce avoidable volatility if those are the actual drivers of missed shifts.
Do not treat every intervention as universal. The right move depends on whether your biggest cost sits in overtime, temp spend, bottleneck coverage, supervisor admin time, or turnover risk.
Match each intervention to a cost lever
Flexible scheduling and better shift-fill tools usually target overtime and open-shift coverage. Cross-training and float pools usually protect throughput and shorten recovery time when a key role goes uncovered.
Attendance policy redesign can reduce avoidable short-notice absences if the current policy creates confusion or perverse incentives. Clear call-out workflows can also cut supervisor time and improve response speed.
Workforce management software can help where the process breaks down between absence notification, replacement outreach, and shift confirmation. That can improve fill rate and reduce the lag between a call-out and a staffing decision.
Integrating reminders, automation, and SMS reminders into workforce management and employee support programs can significantly reduce no shows and improve patient engagement. Automated reminders, especially those that are compliant with healthcare data protection regulations, ensure timely communication, reduce manual workload, and help maintain compliance with standards like HIPAA. These interventions serve as a strategic lever for operational improvement, driving higher attendance rates, better patient satisfaction, and more efficient scheduling.
Employee support programs are different. Their value usually shows up through lower volatility and lower turnover risk over time, not just in same-day coverage. Comprehensive communication strategies and visible leadership commitment are crucial for enhancing the effectiveness of EAPs. That is why it helps to map each intervention to a specific cost lever before you estimate savings.
Reducing attendance volatility is measurable if you treat it like an operating problem, not just a policy problem. The strongest ROI models use plant-specific data, conservative assumptions, and clearly separated cost buckets.
Start where volatility hurts most. That is usually the line, shift, or bottleneck role where coverage gaps drive overtime, throughput loss, or repeat disruption. Run a baseline attendance volatility audit there first, validate the math with finance, and build the case from one pilot line, one plant, or one labor-critical shift.
About the Author

Sheila Stafford, CEO & Co-Founder, TeamSense | Former Manufacturing Leader at GM, Whirlpool, and Fluke
Sheila Stafford is CEO and co-founder of TeamSense. Before launching TeamSense in 2020, she built her career inside manufacturing, starting as a manufacturing engineer at General Motors and later leading teams and product work at Whirlpool. She also served as a general manager at Fluke, where she led the Industrial Imaging business.
That background shapes how she writes about manufacturing operations, absenteeism, frontline communication, and workforce visibility. Stafford has worked close to plant operations, supply chain, product development, and the day-to-day realities of frontline teams. At TeamSense, she works directly with manufacturers on attendance and communication challenges, and her work has also appeared on Forbes Business Council.
