

Fix the root cause of No-Call No-Show with help from TeamSense
Table of Contents
- What "Cost per Absence" Means in a Manufacturing Plant And Why "wages paid" is not the full story
- Identifying Root Causes of Absenteeism in Manufacturing
- Choose Your Calculation Scope and Inputs (Before You Touch a Calculator)
- Step-by-Step: Calculate Direct Labor Cost of a Single Absence
- Add Coverage Cost: Overtime, Cross-Training, and Temp Labor
- Estimate Operational Impact: Downtime, Throughput Loss, and Quality Risk
- Don't Miss Hidden Costs: Supervisor Time and Admin Drag
- Common Pitfalls When Calculating Absence Costs
- Build an Absenteeism Calculator for Manufacturing (Template + Fields)
- Difference Between Absenteeism and Turnover in Manufacturing
- Benchmark Your Rate (Carefully): Absence Rate vs Absenteeism Rate
- Final Thoughts
When one operator is out, the problem is not just the empty spot on the line. It is the scramble to cover, the ripple into quality checks, and the supervisor time that disappears into calls, texts, and schedule edits.
To truly understand and manage the cost per absence in manufacturing, it is important to track attendance and analyze absence patterns. These practices help identify trends, address root causes, and support more effective workforce planning.
Most plants can feel the cost, but they cannot defend the number in a staffing meeting unless they can show the math. The goal here is a simple, repeatable way to calculate cost per absence, using inputs you already have and adding layers only when you can support them with plant data.
What "Cost per Absence" Means in a Manufacturing Plant And Why "wages paid" is not the full story
In a plant, “cost per absence” means the total business impact created by one person missing work for a defined block of time. You may pay wages for that time, but you also may pay overtime, lose output, or spend hours patching the schedule so the shift can run.
This is also why absences hit manufacturing harder than many office environments. Lines have minimum staffing, some jobs require specific qualifications, and the cost of a gap can show up as downtime, slower cycle times, increased quality risk, productivity losses, production delays, and missed deadlines. Unplanned absences and staffing shortages can cause bottlenecks in the production schedule, directly impacting workflow and project timelines.
High absenteeism rates can lead to low output, poor service to customers due to inadequate staff, and negatively affect company revenue, since employee absences can reduce productivity, increase costs, and hurt morale in manufacturing.
A good reality check is that three-quarters of respondents in an SHRM and Kronos study said employee absences have a moderate to large impact on productivity and revenue.
Define what "a single absence" means at your plant
Before you calculate anything, decide what event you are costing. Plants usually mean one of these:
- Unplanned call-out (shift starts short, including sick days)
- Planned absence (PTO scheduled)
- Partial-shift absence (late arrival or early departure)
In facilities with multiple shifts, it is important to track absences across all shifts to ensure accurate cost calculations and to support strategic shift coverage planning in manufacturing.
Then pick the unit that fits how you run production and report labor:
- Cost per hour absent
- Cost per shift absence
- Cost per day absent
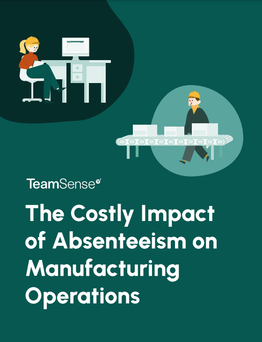
The Costly Impact of Absenteeism on Manufacturing Operations
Learn how chronic, unplanned absenteeism is a costly impediment to manufacturing productivity and efficiency, and how you can reduce absenteeism.
Identifying Root Causes of Absenteeism in Manufacturing
Figuring out why your people keep calling off is step one if you want to cut down on those last-minute scrambles for coverage. You can use an absence rate percentage calculator and absenteeism formula to track who's missing work and when. Look at the numbers over a few months, and you'll start seeing patterns. Maybe third shift has more call-offs than first. Maybe Mondays are brutal. Maybe certain departments are getting hammered while others are fine.
The usual suspects for high call-offs? People feel burned out, the schedule's too rigid, or they're juggling work with kids and can't make it work. Say your plant's absence rate is way above what other facilities are seeing. Time to dig into what's really going on. Could be your team can't find decent childcare. Could be the schedule doesn't give them any wiggle room for doctor appointments or family stuff. When people can't balance their lives, you get more no-shows, production hiccups, and everyone left behind gets cranky.
Fix the real problems and you'll see results. One plant I know had terrible call-offs until they figured out childcare was the issue. They set up on-site care and gave people more schedule options. Call-offs dropped and production smoothed out. Keep tracking your numbers and comparing them to industry benchmarks and use proven strategies to reduce absenteeism in manufacturing. You'll spot trends early and can actually do something about attendance before it tanks your whole operation.
Choose Your Calculation Scope and Inputs (Before You Touch a Calculator)
Scope checklist (decide what counts)
Bad assumptions create bad math. Use this checklist to define what your “cost per absence” will include.
- Include or exclude paid time off wages
- Include or exclude benefits and payroll taxes
- Include or exclude overtime premiums and or temp labor
- Include or exclude lost throughput, downtime, scrap, and rework
- Include or exclude supervisor and admin time
When calculating absence rates, make sure to exclude planned time off such as approved leave, vacation days, and personal days from your calculations, and apply a clear step-by-step absenteeism rate calculation method.
To accurately monitor workforce availability and operational efficiency, use the absenteeism rate formula. The standard formula is: (Total absent days ÷ Total available working days) × 100. Here, total available working days is calculated by multiplying the number of employees by the workdays in the chosen period, excluding weekends, holidays, and approved PTO.
Keep your scope consistent month to month. If you change the rules every time the number looks high, nobody will trust it.
Gather inputs in plant-friendly terms
Here is what you need to pull together to run the calculator, ideally supported by real-time, shift-level attendance reporting instead of lagging monthly reports:
- Base hourly wage or loaded hourly labor rate
- Standard shift length
- Typical coverage method (OT, floaters, temp agency, cross-trained)
- Overtime premium rules for your covered workforce
Tracking attendance and analyzing absence patterns are essential steps. By tracking absenteeism rates, you can identify trends and potential issues within your workforce, which helps improve the accuracy of your cost per absence manufacturing calculations. Monitoring these patterns also allows you to assess the impact of absenteeism on your organization and implement targeted interventions.
If you do not yet have a clean absence log, tools such as TeamSense can surface absence volume, coverage patterns, and shift-level data in one place, which gives you real numbers to work from instead of estimates.
If you need a baseline for how overtime works under federal law, the FLSA requires overtime pay at not less than time and one-half the regular rate of pay for all hours worked over 40 hours in a workweek for covered, nonexempt employees. This is also where headcount vs. skill coverage in manufacturing staffing starts to matter, since who can cover a role is often as important as how many people you have.
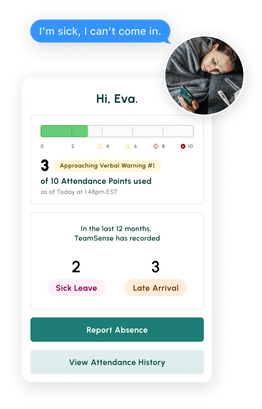
Is your call-in process terrible? Text reduces no-shows and absenteeism by up to 40%.
Don't believe us? Check out this case study to see how this 3PL benefited.
Step-by-Step: Calculate Direct Labor Cost of a Single Absence
Start with the baseline you can defend
Direct labor cost is the simplest layer, and every plant can calculate it. It answers one basic question: what did the absence cost you in labor dollars before you even talk about production impact?
To do this, you need a "loaded hourly rate." That is the employee's wage plus employer-paid add-ons you choose to include, like benefits and payroll taxes.
Direct labor formulas (paid vs unpaid)
Use these equations as your starting point:
Direct cost (paid absence) = Absent hours × Loaded hourly rate
Direct cost (unpaid absence) = 0
Even if the absence is unpaid, do not stop the math there. Unpaid time can still create real costs through coverage, downtime, and admin work.
Example (hypothetical numbers, replace with yours)
Let's say you are costing one unplanned call-out for an 8-hour shift. If your loaded hourly rate for that role is $X, then:
Direct cost (paid absence) = 8 × $X
If the time is unpaid, direct wages are $0, but you still move to the next sections to capture coverage and operational impact.
Add Coverage Cost: Overtime, Cross-Training, and Temp Labor
Common coverage paths and what to count
Most plants cover absences one of four ways, and each one changes the total cost, which is why solid shift coverage planning in manufacturing operations is essential.
Cross-trained internal coverage can look cheaper on paper, but it can carry a ramp-up penalty. In real life, the fill-in may be safe and qualified, but slower on the job or more likely to miss a quality check until they get back in rhythm.
Temp or agency coverage should be priced using the bill rate you actually pay. You can also track onboarding and supervision time as part of admin drag if you have a clean way to capture it.
Production rebalancing is when you pull someone off another line or area. You might avoid overtime, but you can create opportunity cost if the "donor" line slows down or misses its plan.
Calculator-ready structure (two ways to view coverage cost)
Coverage cost is easiest to handle when you separate what you are trying to measure. Some teams want "premium-only" because they consider straight time a wash, and others want "full replacement labor" because it reflects cash out the door.
Use this structure either way:
Coverage cost = (Replacement labor cost for hours covered) − (Labor cost that would have been paid anyway, if applicable)
Premium-only view: count only the incremental premium portion you pay because the replacement is overtime. Full replacement labor view: count the entire replacement labor cost, and subtract only what you truly avoided paying.
Estimate Operational Impact: Downtime, Throughput Loss, and Quality Risk
What operational impact looks like on the floor
Operational impact is what happens when the headcount plan and the line reality do not match. A missing person can trigger line productivity loss in manufacturing through line stoppage due to minimum staffing or a missing qualified role, reduced line speed, delayed changeovers, and higher scrap or rework risk during coverage or understaffing.
This is the part that varies the most by product, staffing model, and constraints. Do not use generic downtime costs unless you can source them and they match your equipment and industry.
Method A: Throughput-based (units and margin)
This method works when you can estimate lost units tied to the absence. It is often the cleanest path for high-volume lines with stable rates.
Method A (throughput-based) = Lost units × Contribution margin per unit
Contribution margin is the money left after variable costs, before fixed overhead. Use your internal standard costs or finance-approved margin logic so you are not arguing definitions later.
Method B: Downtime-based (minutes and value per minute)
This method works when an absence creates measurable downtime or when the line runs slower and you can translate it into lost runtime. The key is using a plant-specific value per minute, not an internet average.
Method B (downtime-based) = Lost runtime minutes × Value per minute of production
Your best internal sources are OEE dashboards, production logs, downtime reason codes, scrap reports, and standard rates. If you cannot support the operational layer with data yet, keep it as an optional field and start capturing it during a pilot.
Don't Miss Hidden Costs: Supervisor Time and Admin Drag
The work nobody schedules but everybody does
Absences create "shadow work" that is real labor cost, even if it does not hit a production job code. The shift still has to be staffed, jobs reassigned, qualifications checked, and timekeeping corrected.
Typical tasks include finding coverage and rescheduling, reassigning work and updating skill matrices, brief training for the replacement, and documentation and timekeeping adjustments. If you are tracking attendance points or leave paperwork, that time counts too.
Use a benchmark, then make it yours
In an SHRM and Kronos study, supervisors reported spending an average of 4.2 hours per week dealing with absences, which the report equates to 210 hours, or 5.3 weeks, per year for organizations open 50 weeks per year.
That does not automatically translate to your plant, but it proves the category is big enough to measure. Your goal is to turn that time into a per-absence estimate you can defend.
A notable portion of that supervisor time often goes to the notification and coverage-confirmation phase before the schedule is even updated the calls, texts, and back-and-forth before anyone knows who is covering. Some teams use a text-based call-off management platform instead of “call a manager” processes to replace that window with a flow that routes absence notifications automatically, which can shorten the per-absence admin clock before the scheduling scramble even begins.
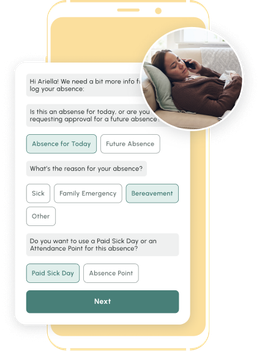
No one wants to talk to their boss or a 1-800 stranger to call off. Text changes everything - Reducing No Call No Shows.
Admin cost line item for your calculator
Use this as a practical line item:
Admin cost per absence = (Supervisor hours per absence × Supervisor loaded hourly rate) + (HR or payroll time × loaded rate)
If you want a broader PTO cost framing for leadership discussions, SHRM's 2014 summary of a survey covering 2013 reported direct PTO cost equivalent to 15.4% of payroll and total cost with indirect costs between 20.9% and 22.1% of payroll. (Source: GlobeNewswire, https://www.globenewswire.com/news-release/2014/12/15/1302340/0/en/Employee-Absences-Have-Consequences-for-Productivity-and-Revenue-SHRM-Research-Shows.html) That context underscores the operational risk of unpredictable attendance in manufacturing, where even small swings in attendance can ripple through productivity, safety, and delivery.
Common Pitfalls When Calculating Absence Costs
Figuring out what absenteeism really costs your plant isn't as straightforward as you'd think. Most places miss the hidden stuff that hits you hard. Like when someone calls off and you're scrambling to find a temp worker. Or paying double-time to get coverage. Those costs pile up fast, especially if you're dealing with a lot of no-shows.
Another thing that trips people up is getting the math wrong on absence rates. You can't just wing it with the calculations. You need the real numbers - how many days people actually miss, total headcount, and all the absent days over the same stretch. Miss any of that and your numbers are garbage, and it becomes harder to address excessive absenteeism with clear policies and manager playbooks.
Here's what I mean. Say you're only looking at what you pay the guy who didn't show up. You're missing the overtime spike for everyone else. The temp agency fees. The extra pressure on your crew when they're short-handed. Get your absence rate formula right and track everything. Then you can actually see what absenteeism costs and figure out how to fix it.
Build an Absenteeism Calculator for Manufacturing (Template + Fields)
Spreadsheet fields (use these as column headers)
Build your first version in a spreadsheet so everyone can see the logic. Use one row per absence event.
- Role/position
- Shift length (hours)
- Paid or unpaid absence flag
- Wage rate
- Loaded rate (if available)
- Coverage type (OT, floater, temp, none)
- Coverage hours
- Coverage cost
- Estimated lost throughput (units)
- Contribution margin per unit
- Downtime minutes
- Value per minute
- Scrap or rework cost (if tracked)
- Supervisor time (hours)
- Total cost per absence (calculated)
Roll-up formulas you can reuse every month
These equations make the calculator repeatable:
Total cost per absence = Direct labor cost + Coverage cost + Operational impact + Admin cost + Quality or scrap impact
Monthly cost of absenteeism = Sum of total cost per absence across all absence events
Cost per absence (average) = Monthly cost of absenteeism ÷ Number of absence events
Implementation rules that keep it simple
Start with a baseline calculator that includes direct labor plus coverage. That gets you a number you can trust fast, even if you are not ready to price throughput or quality yet.
Add operational and quality layers only when plant data exists. If you cannot back it up with OEE, logs, or quality reports, keep those fields blank and treat them as a phase two upgrade.
Difference Between Absenteeism and Turnover in Manufacturing
Look, absenteeism and turnover get lumped together a lot, but they're different problems on the floor. Absenteeism is when your people call off or just don't show up for their shifts. Turnover is when they quit and walk out the door for good. Both mess up your production line, but you've got to handle them differently.
You can track call-offs with an absence rate calculator to see what's really going on. Use that absence rate formula and those measures to spot the patterns - maybe third shift has people calling off every Friday, or one department can't keep people on Mondays. Check your numbers against what other plants are seeing. Industry benchmarks tell you if you're fighting the same battles as everyone else or if you've got bigger problems, and tools like an automated text-based employee call-in solution can give you faster, cleaner data to work with.
Here's the thing - when people start calling off all the time, it usually means something's wrong. Maybe morale's in the tank or people don't see anywhere to go. That can turn into folks just quitting outright. But fixing call-offs won't magically stop people from leaving, and keeping people doesn't mean they'll show up every day. You need to dig into why people aren't coming in and why they're walking away. Give them flexible schedules when you can. Take care of your people's well-being. Track both your absence rates and who's heading for the exit. Fix the real problems, and you'll see fewer empty spots on the schedule and more steady hands on the line.
Benchmark Your Rate (Carefully): Absence Rate vs Absenteeism Rate
Avoid a definition fight
Many HR teams calculate an "absenteeism rate" using scheduled hours as the denominator. That is useful for staffing, but it is not the same as the government's "absence rate," so comparisons can get messy.
BLS defines the absence rate as the ratio of workers with absences to total full-time wage and salary employment.
Use BLS benchmarks only when the definitions match
For a credible external reference, BLS reports the 2024 absence rate for Manufacturing as 2.8%.
For additional context, across frontline manufacturing teams using TeamSense, the average unplanned absence rate is approximately 1.53%, a figure that reflects both a different measurement approach and a population actively managing attendance, so treat it as an additional reference point rather than a universal target.
If you want to compare your plant to that benchmark, make sure you are using the same definition. Consider tracking both of these side by side: your internal absenteeism rate (hours-based) and a BLS-style absence rate (worker-based), if it helps your leadership team.
Final Thoughts
One absence can be cheap or expensive depending on how your plant covers it and how tight your line constraints are. The true cost per absence in manufacturing is a layered calculation, not a single number you can borrow from a benchmark.
Start simple with direct labor plus coverage, then mature the model as you build confidence in throughput, downtime, admin, and quality inputs. Document your assumptions so the results hold up in budgeting, staffing, and labor planning conversations.
If you want to make this real fast, build the spreadsheet, run a 30-day pilot using actual absence events, and review the results with operations, HR, and finance together. Agree on one definition, one set of rules, and one monthly report, then you can manage the problem instead of arguing about the math.
About the Author

Jackie Jones, Content Strategist, TeamSense | Workforce Attendance & Frontline Operations
Jackie Jones is a content strategist at TeamSense, where she has spent the past four years working closely with CEO Sheila Stafford and the TeamSense team to cover the workforce issues that affect manufacturing operations every day. Her work focuses on attendance, absenteeism, shift coverage, frontline communication, supervisor workload, and the operational impact staffing instability has on productivity, overtime, safety, and downtime.
Through direct collaboration with manufacturing leaders and customer-facing teams, Jackie has built deep familiarity with how workforce challenges show up inside real plants and how companies respond when visibility is limited. She writes about frontline operations with a focus on practical problems, clear language, and the day-to-day realities supervisors, HR teams, and plant leaders are trying to solve.
