

Fix the root cause of No-Call No-Show with help from TeamSense
A lot can happen in a year—that’s 365 days with the potential for growth and opportunity. Here at TeamSense, 2022 kept us busy pushing the limits and bringing innovation to the attendance management space.
Here’s a look at the highlight reel for TeamSense in 2022 and the attendance data and absence insights we uncovered along the way.
Save Hundreds of Hours A Year With TeamSense
See how TeamSense saved HelloFresh 3-4 hours per day managing attendance through text. Read the case study and book your demo today!

Communication Remains Key
If there’s one thing employers need easy access to, it’s the ability to communicate with their team. At TeamSense, it’s our job to make the process as smooth as possible. Here’s how our communication numbers stacked up in 2022.
- Number of communicate messages sent by TeamSense: 3,544,857
- Delivery rate of messages sent: 98.5%
- Average number of messages sent by TeamSense companies each week: 2

Biggest Driver of Absences is Sick Leave
With our data, we were able to break down absences by type and see exactly how common certain absences are. Despite sick leave being the most common reason for employee absence, it’s still an encouraging data point. This means more team members are actually using their time off instead of showing up to their shifts while sick.
Top Five Absence Types for TeamSense Customers:
- Sick leave: 52%
- Other leave: 23%
- Late arrival: 12%
- Covid: 10%
- Family emergency: 3%


Benchmarks for Absence Rate and Attendance Rate
In 2022, we discovered two benchmark rates when it comes to absences and attendance. How do employee absences at your company compare to these data points?
- TeamSense benchmark average absence rate: 1.8%
- TeamSense benchmark perfect attendance rate: 35%

Surveys Collect Feedback, More Details
Our survey feature lets TeamSense users dig deeper to gather more information about call offs and gain feedback to improve employee engagement.
- Surveys completed across all customers in 2022: 924,397
Four Most Common Survey Types:
- Call off
- Covid 19
- Feedback
- Custom Survey

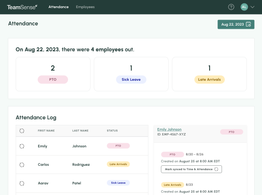
Most Notable Feature: Attendance Insights
In December, we launched Attendance Insights to serve up even more data for our customers. This feature uncovers stats like which employee had the most (or least) absences and surfaces trends like which day of the week most absences take place.
How Does Attendance at Your Company Stack Up?
No matter what industry you serve, this data can provide attendance benchmarks that can help you understand trends and insights when it comes to your own team’s attendance. Ready to take your absence management to the next level? TeamSense makes it simple. Try it now and see how our text-based attendance tracking software can help your company in 2023.
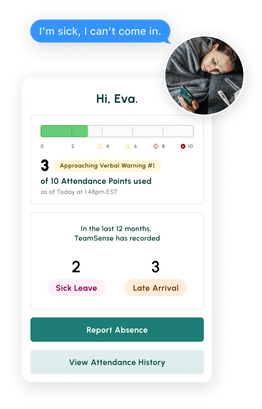
Is your call-in process terrible? Text reduces no-shows and absenteeism by up to 40%.
Don't believe us? Check out this case study to see how this 3PL benefited.
About the Author

Sheila Stafford, CEO & Co-Founder, TeamSense | Former Manufacturing Leader at GM, Whirlpool, and Fluke
Sheila Stafford is CEO and co-founder of TeamSense. Before launching TeamSense in 2020, she built her career inside manufacturing, starting as a manufacturing engineer at General Motors and later leading teams and product work at Whirlpool. She also served as a general manager at Fluke, where she led the Industrial Imaging business.
That background shapes how she writes about manufacturing operations, absenteeism, frontline communication, and workforce visibility. Stafford has worked close to plant operations, supply chain, product development, and the day-to-day realities of frontline teams. At TeamSense, she works directly with manufacturers on attendance and communication challenges, and her work has also appeared on Forbes Business Council.
